
Pandasでは、Series型とDataFrame型を扱う。Series型とDataFrame型の違いはpandasライブラリを使う上で知っておいた方がいい。明確な違いがある。
Pandasで扱うデータ型(SeriesとDataFrame)
知っておくべきポイントは2つ。
・Seriesは一次元、DataFrameは二次元である。
これを知らないとそもそも適切にデータを扱うことができない。知っておくだけでも勉強の効率は上がると思う。
・DataFrame型はJupyter Notebookと相性が良い。
Jupyter Notebook環境上で出力すると、表形式で表現され確認しやすくなる。ポイントはprintを使わないこと。
実際のデータ
実際のデータを記載する。ここでSeries型とDataFrame型の違いのイメージをつかんでもらいたい。
以下のデータを使用して説明する。
id,product,price
1,apple,100
2,orange,30
3,lemon,50
Series
出力を見ると、各データにインデックス番号がついていることがわかる。
import pandas as pd
import numpy as np

data = np.loadtxt("data.csv", delimiter=',', dtype='unicode')
sr_data=pd.Series(data[0])
print(sr_data)

# 出力
# 0         id
# 1    product
# 2      price
# dtype: object
上記のように一次元配列しか扱うことができない、というか一次元専用のデータ型である。
二次元配列をSeries型に変換しようとすると、「1次元にしないとだめだよ」エラーとなる。
Traceback (most recent call last):
  File "<stdin>", line 1, in <module>
  File "/Users/kazuoji/.anyenv/envs/pyenv/versions/3.9.9/lib/python3.9/site-packages/pandas/core/series.py", line 452, in __init__
    data = sanitize_array(data, index, dtype, copy)
  File "/Users/kazuoji/.anyenv/envs/pyenv/versions/3.9.9/lib/python3.9/site-packages/pandas/core/construction.py", line 598, in sanitize_array
    subarr = _sanitize_ndim(subarr, data, dtype, index, allow_2d=allow_2d)
  File "/Users/kazuoji/.anyenv/envs/pyenv/versions/3.9.9/lib/python3.9/site-packages/pandas/core/construction.py", line 649, in _sanitize_ndim
    raise ValueError("Data must be 1-dimensional")
ValueError: Data must be 1-dimensional
DataFrame
DataFrameの場合、直接csvからの読み込みができる。出力を見ると、行方向にインデックス番号、列方向に列名(インデックス)がついていることがわかる。(厳密には行にも任意のインデックスをつけることができる)
import pandas as pd
df_data = pd.read_csv("data.csv")
print(df_data)
# 出力
# id product price
# 0 1 apple 100
# 1 2 orange 30
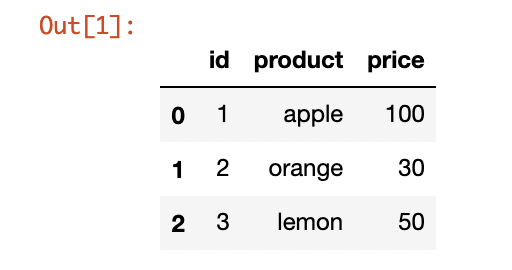
# 2 3 lemon 50DataFrame : Jupyter Notebook環境での見え方
筆者としては、Jupyter Notebook環境での出力され方を知っておくべき、だと思う。ポイントとしては、前節のようにprintで出力しないこと、である。
import pandas as pd

df_data = pd.read_csv("data.csv")

df_data
以下のように表形式で出力されるため、データを確認しやすい。